Longer Term Trading Plans for VTI
- Buy VTI near 285.32 target 294.78 stop loss @ 284.5
- Short VTI slightly under 294.78, target 285.32, stop loss @ 295.63
Swing Trading Plans for VTI
- Buy VTI slightly over 294.78, target 295.48, Stop Loss @ 293.93
- Short VTI slightly near 294.78, target 289.27, Stop Loss @ 295.63.
Day Trading Plans for VTI
- Buy VTI slightly over 294.78, target 295.48, Stop Loss @ 294.09
- Short VTI slightly near 294.78, target 294.06, Stop Loss @ 295.47.
Check the time stamp on this data. Updated AI-Generated Signals for Vanguard Total Stock Market Etf (VTI) available here: VTI.
VTI Ratings for December 28:
| Term → | Near | Mid |
Long |
|---|---|---|---|
| Rating | Strong | Neutral | Strong |
| P1 | 0 | 0 | 285.32 |
| P2 | 294.06 | 289.27 | 294.78 |
| P3 | 298.1 | 295.48 | 302.77 |
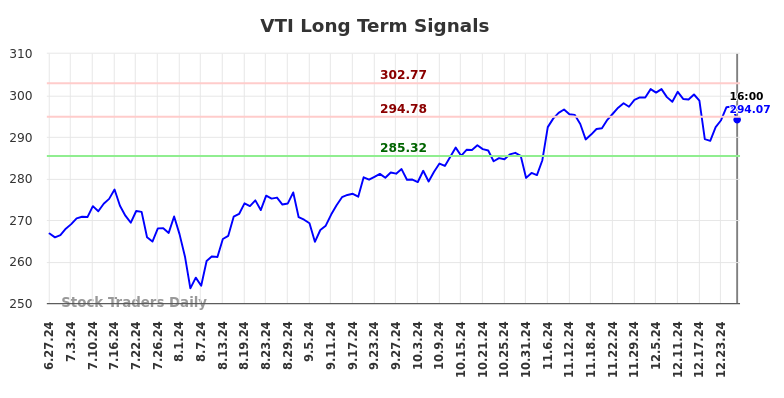
AI Generated Signals for VTI

Blue = Current Price
Red= Resistance
Green = Support
Real Time Updates for Repeat Institutional Readers:
Instructions:
-
Click the Get Real Time Updates button below.
-
In the login prompt, select forgot username
-
Type the email you use for Factset
-
Use the user/pass you receive to login
-
You will have 24/7 access to real time updates.
Click the Get Real Time Updates button below.
In the login prompt, select forgot username
Type the email you use for Factset
Use the user/pass you receive to login
You will have 24/7 access to real time updates.
From then on you can just click to get the real time update whenever you want.
Our Market Crash Leading Indicator isEvitar Corte.
-
Evitar Corte warned of market crash risk four times since 2000.
-
It identified the Internet Debacle before it happened.
-
It identified the Credit Crisis before it happened.
-
It identified the Corona Crash too.
-
See what Evitar Corte is Saying Now.
Get Notified When our Ratings Change:Take a Trial
This Vanguard Total Stock Market Etf (NYSE: VTI) trading report incorporates analysis also used by some of the biggest funds in the world. Review the technical takeaways closely.
Warning:
This is a static report, the data below was valid at the time of the publication, but support and resistance levels for VTI change over time, so the report should be updated regularly. Real Time updates are provided to subscribers. Unlimited Real Time Reports.
Subscribers also receive market analysis, stock correlation tools, macroeconomic observations, timing tools, and protection from market crashes using Evitar Corte.
Instructions:
Instructions:
The rules that govern the data in this report are the rules of Technical Analysis. For example, if VTI is testing support buy signals surface, and resistance is the target. Conversely, if resistance is being tested, that is a sign to control risk or short, and support would be the downside target accordingly. In each case, the trigger point is designed to be both an ideal place to enter a position (avoid trading in the middle of a trading channel), and it acts as a level of risk control too.
Swing Trades, Day Trades, and Longer term Trading Plans:
This data is refined to differentiate trading plans for Day Trading, Swing Trading, and Long Term Investing plans for VTI too. All of these are offered below the Summary Table.
Fundamental Charts for VTI:
If you’re looking to capitalize on market movements in the Vanguard Total Stock Market ETF (VTI), there are a few key strategies you can employ to maximize your returns. Here’s how to take advantage of moves in VTI:
1. Stay Informed: Keep a close eye on market news, economic indicators, and overall trends in the stock market. By staying informed, you can better anticipate potential movements in VTI and make informed decisions about when to buy or sell.
2. Use Technical Analysis: Utilize technical analysis tools to identify potential entry and exit points for VTI. Look for patterns, trends, and key support and resistance levels to help guide your trading decisions.
3. Set Stop-Loss Orders: To protect your downside risk and limit potential losses, consider setting stop-loss orders on your VTI positions. This can help you exit a trade if the price of VTI moves against you, preventing further losses.
4. Consider Leveraged ETFs: If you’re looking to amplify your returns, consider trading leveraged ETFs that track the performance of VTI. These funds use financial derivatives to magnify the returns of VTI, allowing you to potentially earn higher profits in a shorter amount of time.
5. Diversify Your Portfolio: Don’t put all your eggs in one basket. Consider diversifying your portfolio with a mix of assets, including other ETFs, individual stocks, bonds, and other securities. This can help reduce risk and potentially enhance returns over the long term.
By following these strategies, you can take advantage of moves in VTI and potentially enhance your overall investment performance. Remember to always conduct thorough research and consult with a financial advisor before making any investment decisions.
Tags:
- VTI stock price movements
- Investing in VTI
- Vanguard Total Stock Market ETF strategy
- Maximizing profits with VTI
- VTI trading tips
- VTI market analysis
- VTI investment opportunities
- How to profit from VTI movements
- VTI stock market trends
- VTI trading strategies
#Advantage #moves #VTI
Leave a Reply