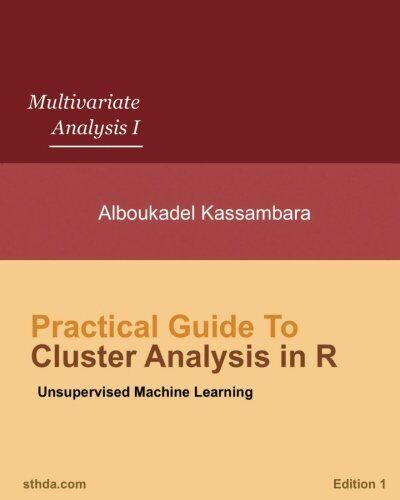
Practical Guide to Cluster Analysis in R: Unsupervised Machine Learning (Mul…
Price : 23.00
Ends on : N/A
View on eBay
Practical Guide to Cluster Analysis in R: Unsupervised Machine Learning (Multiple Techniques)
Cluster analysis is a powerful unsupervised machine learning technique that allows us to group similar data points together based on their characteristics. In this practical guide, we will walk you through how to perform cluster analysis in R using multiple techniques.
1. Selecting the right clustering algorithm:
Before diving into cluster analysis, it is important to choose the right clustering algorithm based on the nature of your data and the goals of your analysis. Some popular clustering algorithms include K-means, hierarchical clustering, DBSCAN, and Gaussian mixture models.
2. Preprocessing the data:
Before applying any clustering algorithm, it is crucial to preprocess the data to ensure that it is in the right format. This includes handling missing values, normalizing or standardizing the data, and removing any outliers that may affect the clustering results.
3. Choosing the number of clusters:
One of the key decisions in cluster analysis is determining the optimal number of clusters to use. There are several methods available to help you with this, such as the elbow method, silhouette score, and gap statistics.
4. Applying the clustering algorithm:
Once you have preprocessed the data and chosen the number of clusters, it is time to apply the clustering algorithm. In R, you can use functions such as kmeans(), hclust(), dbscan(), and Mclust() to perform K-means clustering, hierarchical clustering, DBSCAN, and Gaussian mixture models, respectively.
5. Evaluating the clustering results:
After applying the clustering algorithm, it is important to evaluate the results to assess the quality of the clusters. Common evaluation metrics include silhouette score, Dunn index, and Davies-Bouldin index.
6. Visualizing the clusters:
To gain a better understanding of the clustering results, it is helpful to visualize the clusters using plots such as scatter plots, dendrograms, and heatmaps. R provides several packages, such as ggplot2, dendextend, and pheatmap, that can help you create informative visualizations.
By following these steps, you can effectively perform cluster analysis in R and uncover meaningful patterns and insights in your data. Experiment with different clustering algorithms and techniques to find the best approach for your specific dataset and research question. Happy clustering!
#Practical #Guide #Cluster #Analysis #Unsupervised #Machine #Learning #Mul..

Leave a Reply
You must be logged in to post a comment.