Your cart is currently empty!
Tag: Chart

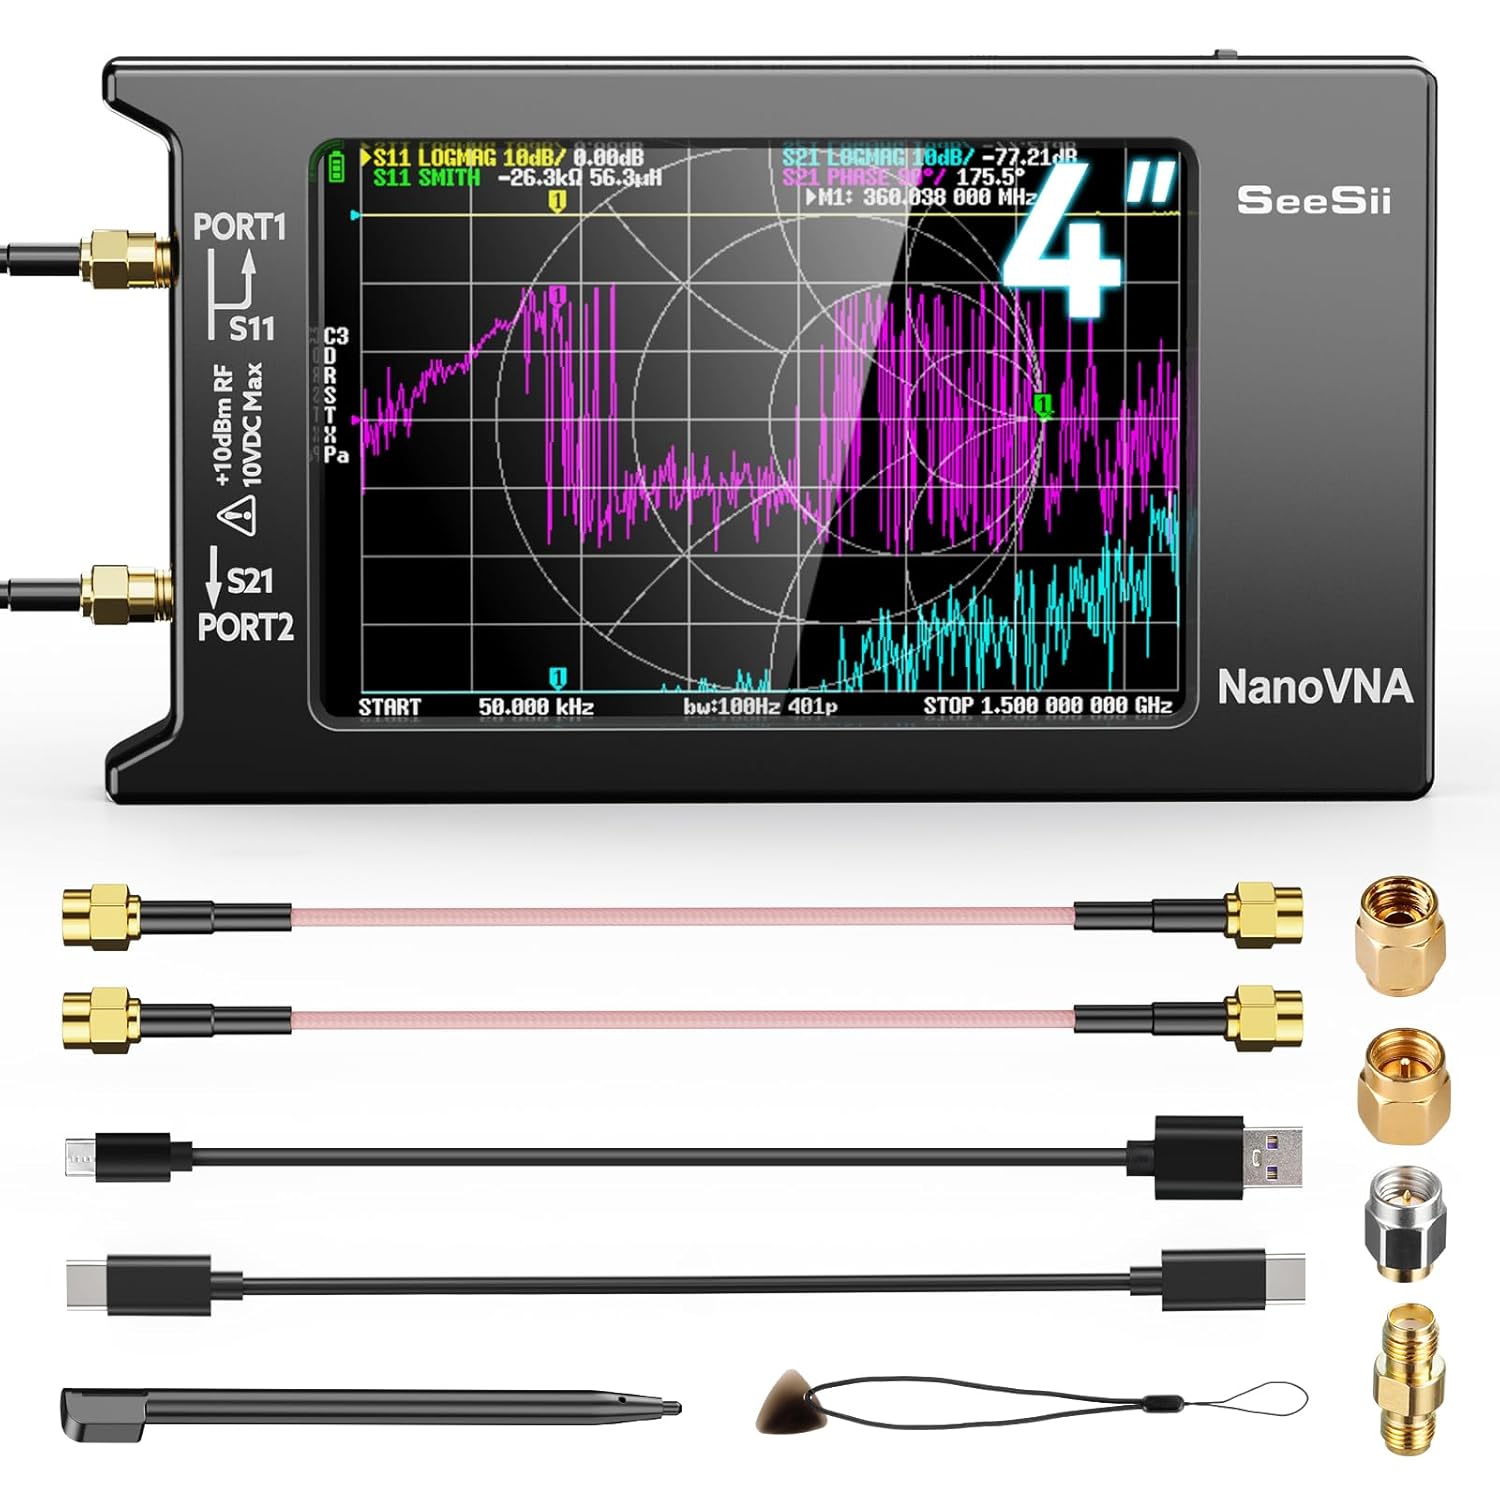
SeeSii Upgraded NanoVNA-H4 Vector Network Analyzer, Latest V4.3 10KHz-1.5GHz HF VHF UHF 4″ Touch Screen VNA Antenna Analyzer Measures S Parameters,Voltage Standing Wave Ratio, Phase,Delay, Smith Chart
Price:$105.99– $98.85
(as of Dec 04,2024 07:17:20 UTC – Details)
Seesii always insists on providing our customers with accurate and practical testing instruments and maintenance equipment.
Package Dimensions : 6.61 x 4.84 x 2.17 inches; 11.99 ounces
Item model number : NanoVNA-H4
Batteries : 1 Lithium Ion batteries required.
Date First Available : March 2, 2020
Manufacturer : Seesii
ASIN : B085CFHTBMUPGRADED NANOVNA ANALYZER: SeeSii Nanovna-h4 Vector Network Analyzer is developed by Hugen. With latest 4.3 version,10KHz-1.5GHz measure range,4.0 inch LCD touchscreen,mini and portable design.This Antenna Analyzer is provides outstanding vector network measurement capabilities and perfect for evaluating antenna resonance and SWR.It is a very handy & smart analyzer for electronics engineer, amateur radio operators or radio diy amateurs
BUILT-IN MICRO-SD PORT & TIME DISPLAY: The lastest antenna analyzer with MicroSD card port,so you can save field test data or screens to a MicroSD card at any time,support up to 32GB memory card. (Not include in the pacakge).In addition, different from old version NanoVNAs, the date and time can be customized, which is convenient for you to further record and save data..The default firmware main function is used for antenna performance measurement
IMPROVED FREQUENCY ALGORITHM:The Vector Network Analyzer can use the old harmonic extension of si5351 to support the measurement frequency up to 1.5GHz. The 50K-300MHz frequency range of the si5351 direct output provides better than 70dB dynamic, The extended 300M-900MHz band provides better than 60dB of dynamics, and the 900M-1.5GHz band is better than 40dB of dynamics.Great for trouble shooting antennas and improving performance
PC CONNECTION & TX/RX FUNCTION:The vna analyzer uses PC software NanoVNASaver, it can connect to a NanoVNA and extracts the data for display on a computer for saving to Touchstone files. We can export Touchstone (snp) files for various radio design and simulation software through PC software.In addition,the default firmware is mainly used for antenna performance measurement. The TX/RX method can measure the complete S11/S21 parameters (need to manually replace the transceiver port wiring)
Abundant Accessories:Equipped with 1x NanoVNA-H4(with 1950mA-h battery), 1x USB Type-C cable, 2 x 15cm SMA male to male RG316 RF cable, 1x SMA male calibration kit – OPEN,1x SMA male calibration kit – SHORT ,1 x SMA male calibration kit – LOAD,1 x Touchscreen pen.It’s very useful as an antenna analyzer for your ham station, easy to set without fancy calibration
Reliable After-Sales Service:We provide professional technical support to keep you away from after-sales worries. If you are not satisfied with SeeSii Nanovna Vector Analyzer or have any other questions, please feel free to contact us. Our after-sales service experts will reply to your information as soon as possible, We will do our best to solve your problems, and you can purchase and experience with confidenceCustomers say
Customers like the functionality, value for money, and accuracy of the product. They mention it’s a very useful tool, works great, and is good quality for the price. Some also like the size. However, some customers have reported issues with the touch screen quality. Opinions differ on ease of use, build quality, and visibility.
AI-generated from the text of customer reviews
Introducing the SeeSii Upgraded NanoVNA-H4 Vector Network Analyzer!Upgrade your testing capabilities with the latest V4.3 version of the NanoVNA-H4, offering a wide frequency range of 10KHz to 1.5GHz for HF, VHF, and UHF applications. This powerful tool comes equipped with a 4″ touch screen display, making it easy to navigate and analyze data.
With the NanoVNA-H4, you can measure S parameters, Voltage Standing Wave Ratio (VSWR), phase, delay, and even generate Smith Charts for a comprehensive understanding of your antenna performance. Whether you’re a hobbyist, engineer, or technician, this VNA antenna analyzer is a must-have for accurate and efficient testing.
Upgrade to the SeeSii Upgraded NanoVNA-H4 Vector Network Analyzer and take your testing capabilities to the next level! #VectorNetworkAnalyzer #AntennaAnalyzer #SeeSii #NanoVNAH4 #UpgradeYourTesting
#SeeSii #Upgraded #NanoVNAH4 #Vector #Network #Analyzer #Latest #V4.3 #10KHz1.5GHz #VHF #UHF #Touch #Screen #VNA #Antenna #Analyzer #Measures #ParametersVoltage #Standing #Wave #Ratio #PhaseDelay #Smith #Chart
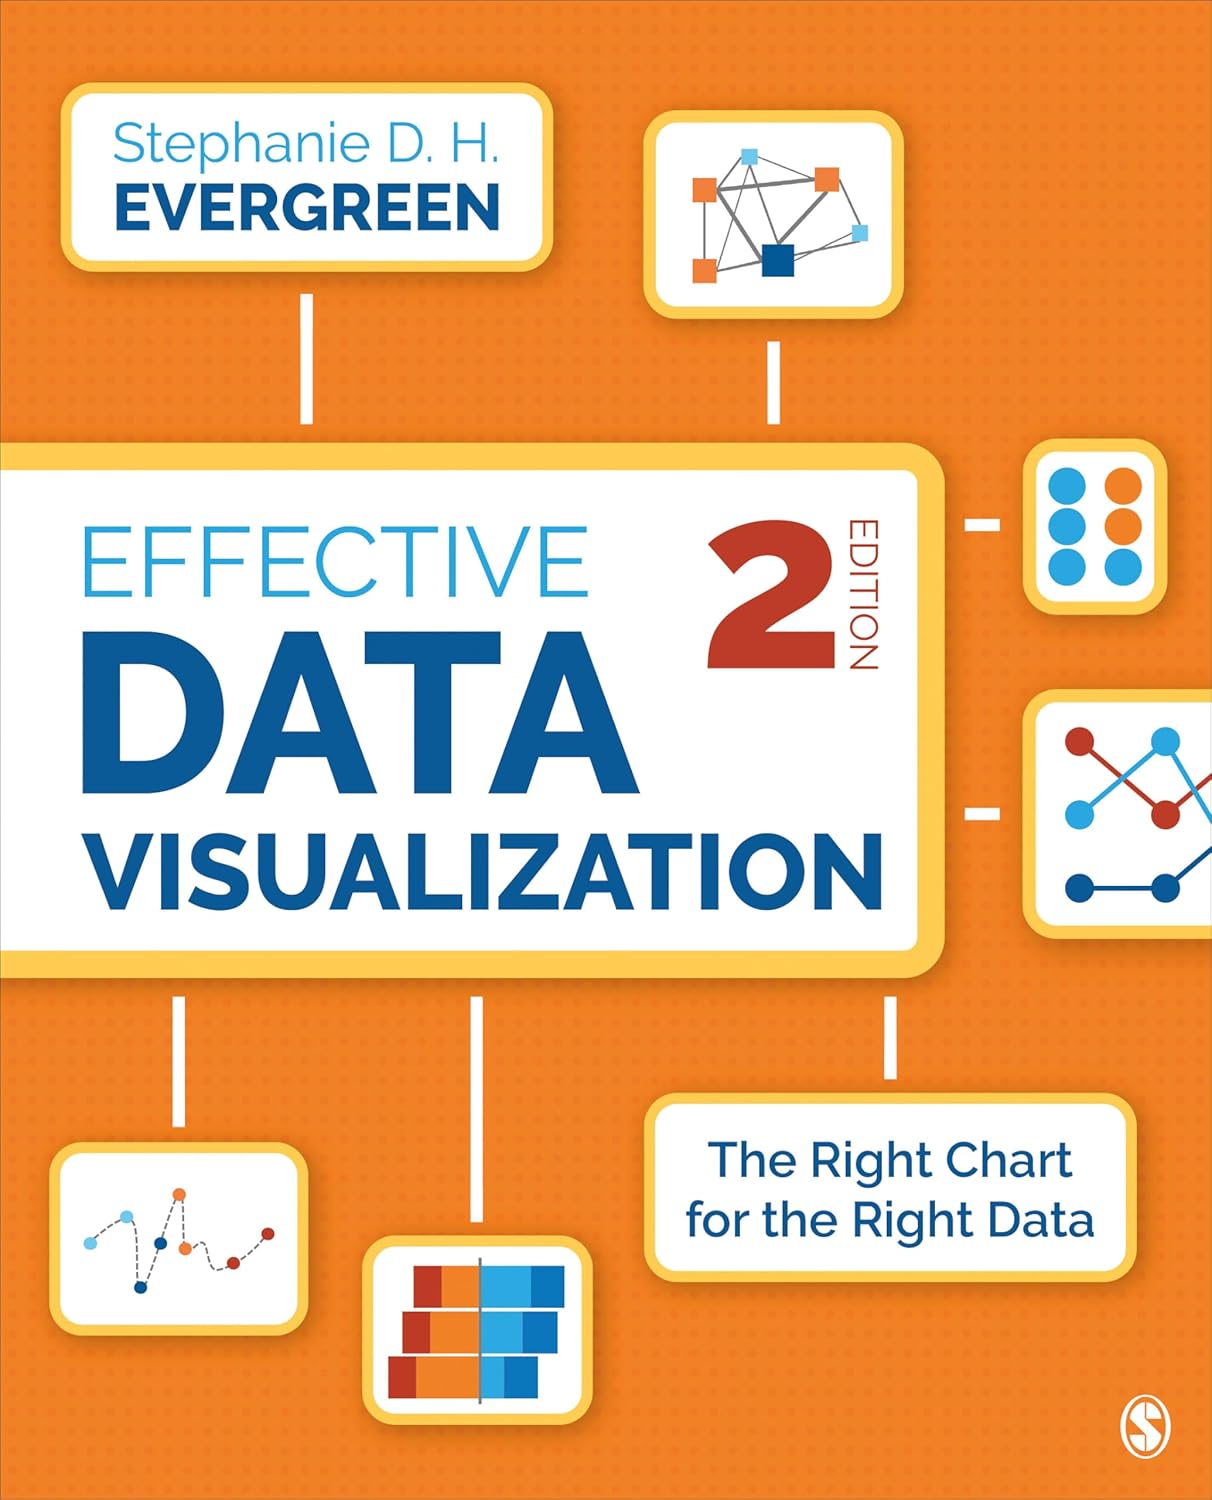
Effective Data Visualization: The Right Chart for the Right Data
Price:$75.00– $63.52
(as of Nov 23,2024 06:11:43 UTC – Details)
Publisher : SAGE Publications, Inc; 2nd edition (May 14, 2019)
Language : English
Paperback : 352 pages
ISBN-10 : 1544350880
ISBN-13 : 978-1544350882
Item Weight : 1.55 pounds
Dimensions : 7.38 x 0.8 x 9.13 inchesCustomers say
Customers find the book very straightforward, well-organized, and user-friendly. They also say it’s a great informational book and great for data analysis professionals.
AI-generated from the text of customer reviews
In the world of data visualization, choosing the right chart for your data is crucial in effectively communicating your findings and insights. Different types of data lend themselves to different types of charts, and selecting the appropriate one can make all the difference in how easily your audience can understand and interpret the information.Bar charts are great for comparing values across different categories, while line charts are ideal for showing trends over time. Pie charts can effectively represent proportions of a whole, and scatter plots are perfect for displaying relationships between two variables.
When selecting a chart, consider the message you want to convey and the type of data you have. Is it categorical or numerical? Is it time-series data or comparing different groups? By matching the right chart to your data, you can create visualizations that are clear, concise, and impactful.
Remember, the goal of data visualization is to make complex information more accessible and understandable. By choosing the right chart for your data, you can effectively communicate your insights and drive decision-making in your organization.
#Effective #Data #Visualization #Chart #Data
