Your cart is currently empty!
Tag: Statistical

Mastering SAS: A Guide to Data Analysis and Statistical Modeling
SAS (Statistical Analysis System) is a powerful software suite used for data analysis and statistical modeling. Mastering SAS: A Guide to Data Analysis and Statistical Modeling is a comprehensive book that helps users understand and utilize SAS to its full potential.The book covers a wide range of topics, starting with the basics of SAS programming and data manipulation. It then moves on to more advanced topics such as statistical modeling, data mining, and predictive analytics. The authors provide clear and concise explanations, along with practical examples and exercises to help readers apply what they have learned.
One of the key features of Mastering SAS is its focus on real-world applications. The authors demonstrate how SAS can be used in various industries such as healthcare, finance, and marketing to analyze data and make informed decisions. This practical approach helps readers see the value of SAS in their own work and motivates them to explore its capabilities further.
The book also covers the latest features and updates in SAS, including the integration of machine learning algorithms and the use of SAS Viya for cloud-based analytics. This ensures that readers are up to date with the latest advancements in data analysis and statistical modeling.
Whether you are a beginner looking to learn the basics of SAS or an experienced user seeking to enhance your skills, Mastering SAS: A Guide to Data Analysis and Statistical Modeling is a valuable resource. Its comprehensive coverage, practical examples, and real-world applications make it an essential guide for anyone looking to master SAS and harness its full potential for data analysis and statistical modeling.

The Evolution of SAS: From Statistical Software to Business Intelligence Tool
The Evolution of SAS: From Statistical Software to Business Intelligence ToolSAS, which stands for Statistical Analysis System, is a software suite developed by SAS Institute for advanced analytics, business intelligence, data management, and predictive analytics. Originally created in the 1960s as a tool for statistical analysis, SAS has evolved over the years to become a powerful business intelligence tool used by companies and organizations around the world.
In its early days, SAS was primarily used by statisticians and researchers to perform complex data analysis and generate reports. The software was known for its robust statistical capabilities and its ability to handle large datasets. As the demand for data analytics grew in the business world, SAS expanded its offerings to include data management, data visualization, and predictive modeling tools.
One of the key milestones in the evolution of SAS was the introduction of SAS Business Intelligence in the early 2000s. This new suite of tools allowed users to create interactive reports, dashboards, and data visualizations, making it easier for businesses to analyze and interpret their data. With the rise of big data and the increasing importance of data-driven decision-making, SAS Business Intelligence became an essential tool for companies looking to gain insights from their data.
In recent years, SAS has continued to innovate and expand its capabilities. The software now includes advanced analytics tools such as machine learning, artificial intelligence, and natural language processing. These tools allow users to uncover hidden patterns and insights in their data, enabling them to make more informed decisions and drive business growth.
SAS has also embraced the trend towards cloud computing, offering its software as a service through the SAS Viya platform. This cloud-based solution allows users to access SAS tools and applications from anywhere, making it easier to collaborate and share insights with colleagues.
Overall, the evolution of SAS from a statistical software to a comprehensive business intelligence tool highlights the importance of data analytics in today’s business environment. With its powerful analytics capabilities and user-friendly interface, SAS continues to be a leading choice for companies looking to unlock the potential of their data. As technology continues to advance, it will be interesting to see how SAS further evolves to meet the growing demands of the data-driven business world.

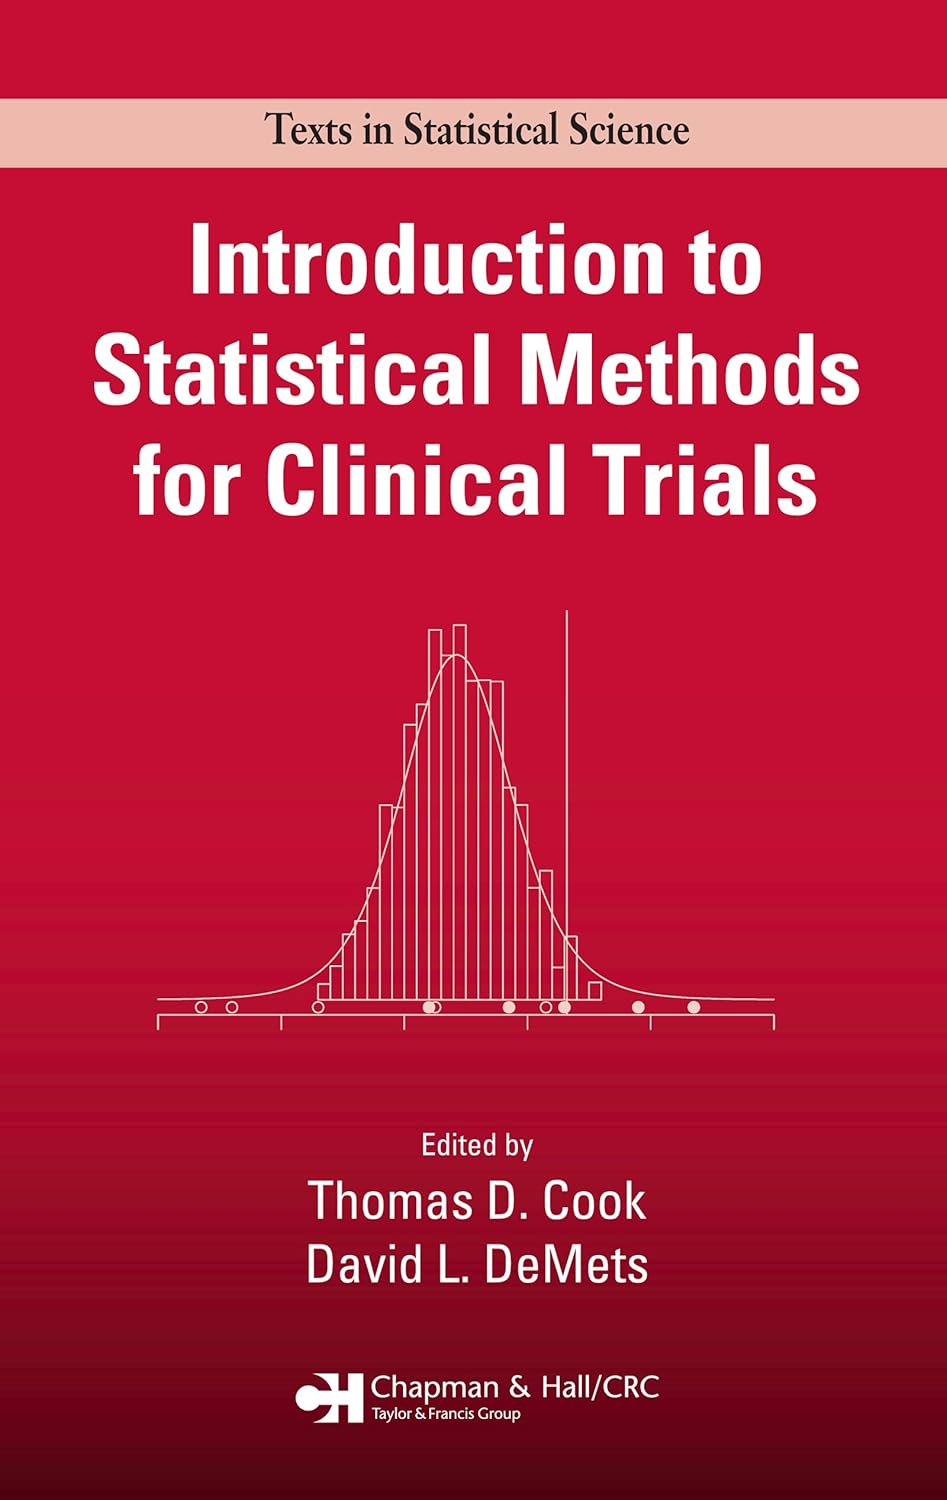
Introduction to Statistical Methods for Clinical Trials (Chapman & Hall/CRC Texts in Statistical Science)
Price: $39.99
(as of Nov 29,2024 02:25:29 UTC – Details)
ASIN : B00OD4WLNS
Publisher : Chapman and Hall/CRC; 1st edition (November 19, 2007)
Publication date : November 19, 2007
Language : English
File size : 9392 KB
Simultaneous device usage : Up to 4 simultaneous devices, per publisher limits
Text-to-Speech : Not enabled
Enhanced typesetting : Not Enabled
X-Ray : Not Enabled
Word Wise : Not Enabled
Print length : 464 pages
Format : Print Replica
Are you interested in learning about statistical methods in clinical trials? Look no further than “Introduction to Statistical Methods for Clinical Trials” by Chapman & Hall/CRC Texts in Statistical Science. This comprehensive book covers everything you need to know about designing, analyzing, and interpreting clinical trials.Whether you are a student, researcher, or practitioner in the field of clinical trials, this book is an invaluable resource. It covers key topics such as randomization, sample size determination, data analysis, and reporting results. With clear explanations and examples, this book will help you navigate the complex world of clinical trials with confidence.
Don’t miss out on this essential guide to statistical methods in clinical trials. Pick up your copy of “Introduction to Statistical Methods for Clinical Trials” today and take your understanding of clinical research to the next level.
#Introduction #Statistical #Methods #Clinical #Trials #Chapman #HallCRC #Texts #Statistical #Science
Using R for Data Management Statistical Analysis and – by Horton

Using R for Data Management Statistical Analysis and – by Horton
Price : 105.95
Ends on : N/A
View on eBay
R is a powerful programming language and software environment for statistical computing and graphics. It is widely used by data analysts and researchers for data management, statistical analysis, and visualization.In his book “Using R for Data Management, Statistical Analysis, and Graphics,” author Robert A. Horton provides a comprehensive guide to using R for various data analysis tasks. The book covers topics such as data manipulation, data visualization, statistical modeling, and machine learning.
One of the key advantages of using R for data analysis is its ability to handle large datasets and perform complex statistical calculations. R also has a wide range of packages and libraries that provide additional functionality for specific tasks, such as time series analysis, regression analysis, and cluster analysis.
If you are new to R or looking to expand your skills in data analysis, “Using R for Data Management, Statistical Analysis, and Graphics” is a valuable resource that can help you harness the full power of R for your data analysis needs. Whether you are a student, researcher, or data analyst, this book can serve as a practical guide to using R for data management and statistical analysis.
#Data #Management #Statistical #Analysis #Horton
Exploring the Power of SAS in Statistical Analysis
SAS, which stands for Statistical Analysis System, is a powerful software suite that is widely used for data management, statistical analysis, and predictive modeling. With its robust set of tools and capabilities, SAS has become a popular choice for researchers, analysts, and data scientists looking to gain valuable insights from their data.One of the key strengths of SAS is its ability to handle large and complex datasets with ease. Whether you are working with structured or unstructured data, SAS provides a wide range of options for data manipulation, cleansing, and transformation. This enables users to prepare their data for analysis quickly and efficiently, saving time and effort in the process.
In addition to data management, SAS offers a comprehensive set of statistical procedures for conducting various types of analyses. From basic descriptive statistics to advanced regression and time series modeling, SAS provides a rich collection of tools for exploring relationships, making predictions, and testing hypotheses. Its intuitive programming language, SAS Macro, allows users to automate repetitive tasks and customize analyses to meet specific research needs.
Moreover, SAS offers a variety of graphical and visualization tools that help users to interpret their results and communicate their findings effectively. Whether you need to create scatter plots, histograms, or heatmaps, SAS provides a range of options for visualizing data in a clear and informative manner.
Another key feature of SAS is its flexibility and scalability. Whether you are working on a small project or a large-scale research study, SAS can accommodate your needs. With its ability to run on multiple platforms and integrate with other software systems, SAS offers a seamless experience for users working in diverse environments.
Overall, SAS is a powerful tool for statistical analysis that offers a wide range of capabilities for data management, modeling, and visualization. Whether you are a beginner or an experienced user, SAS provides the tools and resources you need to explore the power of statistics and make informed decisions based on data-driven insights.

The Benefits of Using SAS for Statistical Analysis
Statistical analysis is an essential component of any research or data analysis project. It involves collecting, organizing, analyzing, interpreting, and presenting data in a meaningful way to draw conclusions and make informed decisions. There are several software tools available for statistical analysis, with SAS being one of the most popular and widely used options.SAS, which stands for Statistical Analysis System, is a powerful software suite that is specifically designed for statistical analysis and data management. It offers a wide range of features and capabilities that make it a preferred choice for researchers, data analysts, and statisticians. Here are some of the key benefits of using SAS for statistical analysis:
1. Comprehensive functionality: SAS offers a wide range of statistical procedures and techniques that allow users to perform various types of data analysis, from simple descriptive statistics to complex multivariate analysis. Whether you need to run basic tests like t-tests and ANOVA, or advanced analyses like regression analysis and factor analysis, SAS has you covered.
2. Data management capabilities: In addition to statistical analysis, SAS also provides robust data management tools that allow users to manipulate and clean data before conducting analysis. This includes data import/export, data transformation, data merging, and data cleaning functionalities that help ensure the quality and accuracy of the data being analyzed.
3. Scalability and performance: SAS is known for its scalability and performance, making it suitable for handling large datasets and complex analyses. It is optimized for efficiency and speed, allowing users to perform analyses quickly and accurately even with massive amounts of data.
4. Graphical capabilities: SAS offers a variety of graphical tools and visualization options that help users visualize and interpret their data more effectively. Users can create a wide range of graphs, charts, and plots to communicate their findings and insights in a clear and concise manner.
5. Integration with other software: SAS can easily integrate with other software tools and platforms, allowing users to import and export data from various sources and formats. This interoperability makes it easier for users to work with different data sources and collaborate with colleagues who may be using different tools.
6. User-friendly interface: Despite its advanced features and capabilities, SAS is relatively easy to use and navigate, even for those with limited programming experience. The software provides a user-friendly interface that allows users to perform analyses and generate reports with minimal effort.
In conclusion, SAS is a versatile and powerful software tool that offers a wide range of benefits for statistical analysis. Its comprehensive functionality, data management capabilities, scalability, performance, graphical tools, integration with other software, and user-friendly interface make it an ideal choice for researchers, data analysts, and statisticians looking to conduct robust and reliable data analysis. Whether you are working with small datasets or big data, SAS can help you analyze your data effectively and make informed decisions based on solid statistical evidence.

SAS and R: Data Management, Statistical Analysis, and Graphics

SAS and R: Data Management, Statistical Analysis, and Graphics
Price : 20.26
Ends on : N/A
View on eBay
SAS and R: Data Management, Statistical Analysis, and GraphicsIn the world of data science and statistical analysis, two popular tools that are often compared and contrasted are SAS and R. Both SAS and R are powerful programming languages that are widely used for data management, statistical analysis, and graphics.
Data Management:
SAS is known for its robust data management capabilities, offering a wide range of tools for data manipulation, cleansing, and merging. With SAS, users can easily import data from various sources, clean and transform data, and create datasets for analysis.R, on the other hand, also has strong data management capabilities, with packages like dplyr and tidyr that make it easy to manipulate and clean data. R’s data manipulation functions are highly efficient and flexible, making it a popular choice for data scientists and statisticians.
Statistical Analysis:
Both SAS and R are widely used for statistical analysis, offering a wide range of statistical procedures and tests. SAS has a comprehensive set of statistical procedures built into its software, making it easy to perform complex analyses without the need for additional packages.R, on the other hand, is known for its extensive library of packages for statistical analysis. The CRAN repository contains thousands of packages for various statistical procedures, making R a highly versatile tool for data analysis.
Graphics:
When it comes to creating graphics and visualizations, both SAS and R have strong capabilities. SAS offers a variety of built-in graphics procedures for creating basic plots and charts, while R’s ggplot2 package is widely used for creating sophisticated and customizable visualizations.Overall, both SAS and R are powerful tools for data management, statistical analysis, and graphics. The choice between the two often comes down to personal preference, as well as the specific needs of the analysis being performed. Whether you choose SAS or R, you can be confident that you are using a tool that is widely respected in the data science community.
#SAS #Data #Management #Statistical #Analysis #Graphics
Statistical Data Analysis and Management Science (CUSTOM for Old Dominion – GOOD

Statistical Data Analysis and Management Science (CUSTOM for Old Dominion – GOOD
Price : 4.64
Ends on : N/A
View on eBay
Statistical Data Analysis and Management Science at Old Dominion University: A Comprehensive OverviewAt Old Dominion University, students have the opportunity to delve into the dynamic fields of statistical data analysis and management science through a customized program that prepares them for success in a variety of industries.
In this program, students will learn the fundamental principles of statistical analysis, data management, and decision-making processes. They will also develop critical thinking skills and problem-solving abilities that are essential for navigating the complex world of business and technology.
Through hands-on projects and real-world case studies, students will gain practical experience in applying statistical methods to analyze data, make informed decisions, and optimize processes. They will also have the opportunity to work with industry professionals and experts in the field, gaining valuable insights and networking opportunities.
With a strong emphasis on practical skills and real-world applications, Old Dominion University’s program in Statistical Data Analysis and Management Science equips students with the knowledge and tools they need to succeed in today’s data-driven world. Whether you are interested in pursuing a career in business, healthcare, finance, or any other field, this program will provide you with the expertise and experience you need to excel.
Join us at Old Dominion University and take your first step towards a rewarding career in Statistical Data Analysis and Management Science. Apply now and unlock your potential in this exciting and rapidly growing field.
#Statistical #Data #Analysis #Management #Science #CUSTOM #Dominion #GOOD
The Evolution of SAS: From Statistical Analysis System to Business Analytics Powerhouse
SAS, originally known as the Statistical Analysis System, has come a long way since its inception in the early 1970s. What started as a tool for statistical analysis has evolved into a powerhouse in the field of business analytics.The journey of SAS from a statistical analysis tool to a comprehensive business analytics platform is a testament to the company’s ability to adapt to the changing needs of the industry. Over the years, SAS has continually expanded its capabilities and offerings to meet the growing demands of businesses for data-driven insights.
One of the key factors that has contributed to the evolution of SAS is its focus on innovation. The company has consistently invested in research and development to stay ahead of the curve in terms of technology and analytical techniques. This commitment to innovation has enabled SAS to develop cutting-edge solutions that help businesses make better decisions based on data.
Another important aspect of SAS’s evolution is its emphasis on user-friendliness and accessibility. In the early days, SAS was primarily used by statisticians and data scientists who had a deep understanding of statistical methods. However, in order to reach a wider audience, SAS has worked to make its tools more intuitive and user-friendly. This has allowed business users with varying levels of technical expertise to harness the power of analytics to drive better decision-making.
In recent years, SAS has also embraced the trend towards cloud computing and big data analytics. The company has developed cloud-based solutions that enable businesses to easily access and analyze large volumes of data, regardless of their size or industry. This shift towards cloud-based analytics has made it easier for businesses to leverage the power of data to drive growth and innovation.
Today, SAS is recognized as a leader in the field of business analytics, with a wide range of offerings that cater to the needs of businesses of all sizes and industries. From predictive analytics to machine learning, SAS provides tools and solutions that help businesses extract valuable insights from their data and make informed decisions.
In conclusion, the evolution of SAS from a statistical analysis system to a business analytics powerhouse is a testament to the company’s commitment to innovation and customer satisfaction. By staying ahead of the curve in terms of technology and analytical techniques, SAS has cemented its position as a leader in the field of business analytics, helping businesses around the world unlock the power of data to drive success.

Getting Started with SAS: A Beginner’s Guide to Statistical Analysis
If you’re new to the world of statistical analysis and looking to get started with SAS, you’ve come to the right place. SAS is a powerful software platform used for data management, advanced analytics, and business intelligence. It’s widely used in industries such as healthcare, finance, and marketing for its ability to handle large datasets and perform complex statistical analyses.Getting started with SAS may seem intimidating at first, but with the right resources and a little practice, you’ll be on your way to mastering this powerful tool. In this beginner’s guide, we’ll walk you through the basics of SAS and help you get started with statistical analysis.
First things first, you’ll need to download and install SAS on your computer. SAS offers a free version called SAS University Edition, which is perfect for beginners looking to get their feet wet with the software. Simply visit the SAS website, create an account, and follow the instructions to download and install SAS University Edition on your computer.
Once you have SAS up and running, it’s time to familiarize yourself with the interface. SAS has a user-friendly interface that allows you to write and execute code, import and export data, and view your results in a variety of formats. Take some time to explore the different menus and options in SAS to get a feel for how the software works.
Next, you’ll want to learn the basics of SAS programming. SAS uses a programming language called SAS programming language, which is used to perform data manipulation, statistical analysis, and reporting. The SAS programming language is relatively easy to learn, with simple syntax and a wide range of functions and procedures to help you analyze your data.
One of the most common tasks in statistical analysis is data manipulation and cleaning. SAS offers a variety of tools and functions to help you clean and prepare your data for analysis. You can use the DATA step to create new variables, filter out missing values, and merge datasets together. The PROC step allows you to perform advanced statistical analyses such as regression, ANOVA, and t-tests.
Once you have your data cleaned and prepared, it’s time to start analyzing your data. SAS offers a wide range of statistical procedures to help you analyze your data and draw meaningful conclusions. Whether you’re looking to perform descriptive statistics, inferential statistics, or predictive modeling, SAS has the tools you need to get the job done.
In conclusion, getting started with SAS may seem daunting at first, but with the right resources and a little practice, you’ll be well on your way to mastering this powerful software platform. By familiarizing yourself with the interface, learning the basics of SAS programming, and exploring the various statistical procedures available, you’ll be able to conduct meaningful analyses and make data-driven decisions in no time. So what are you waiting for? Dive into the world of SAS and start your journey to becoming a statistical analysis expert today.
